AI GTM Command Center: Turning CRM Data into Prioritized Sales Action
What This Project Does
The AI GTM Command Center helps a sales team understand what is happening inside its CRM without manually checking hundreds of contacts, companies and opportunities.
It connects to HubSpot and turns raw CRM records into four practical answers:
- Who should we focus on first?
- Who needs a follow-up?
- Which deals are stuck?
- Where is the CRM data messy?
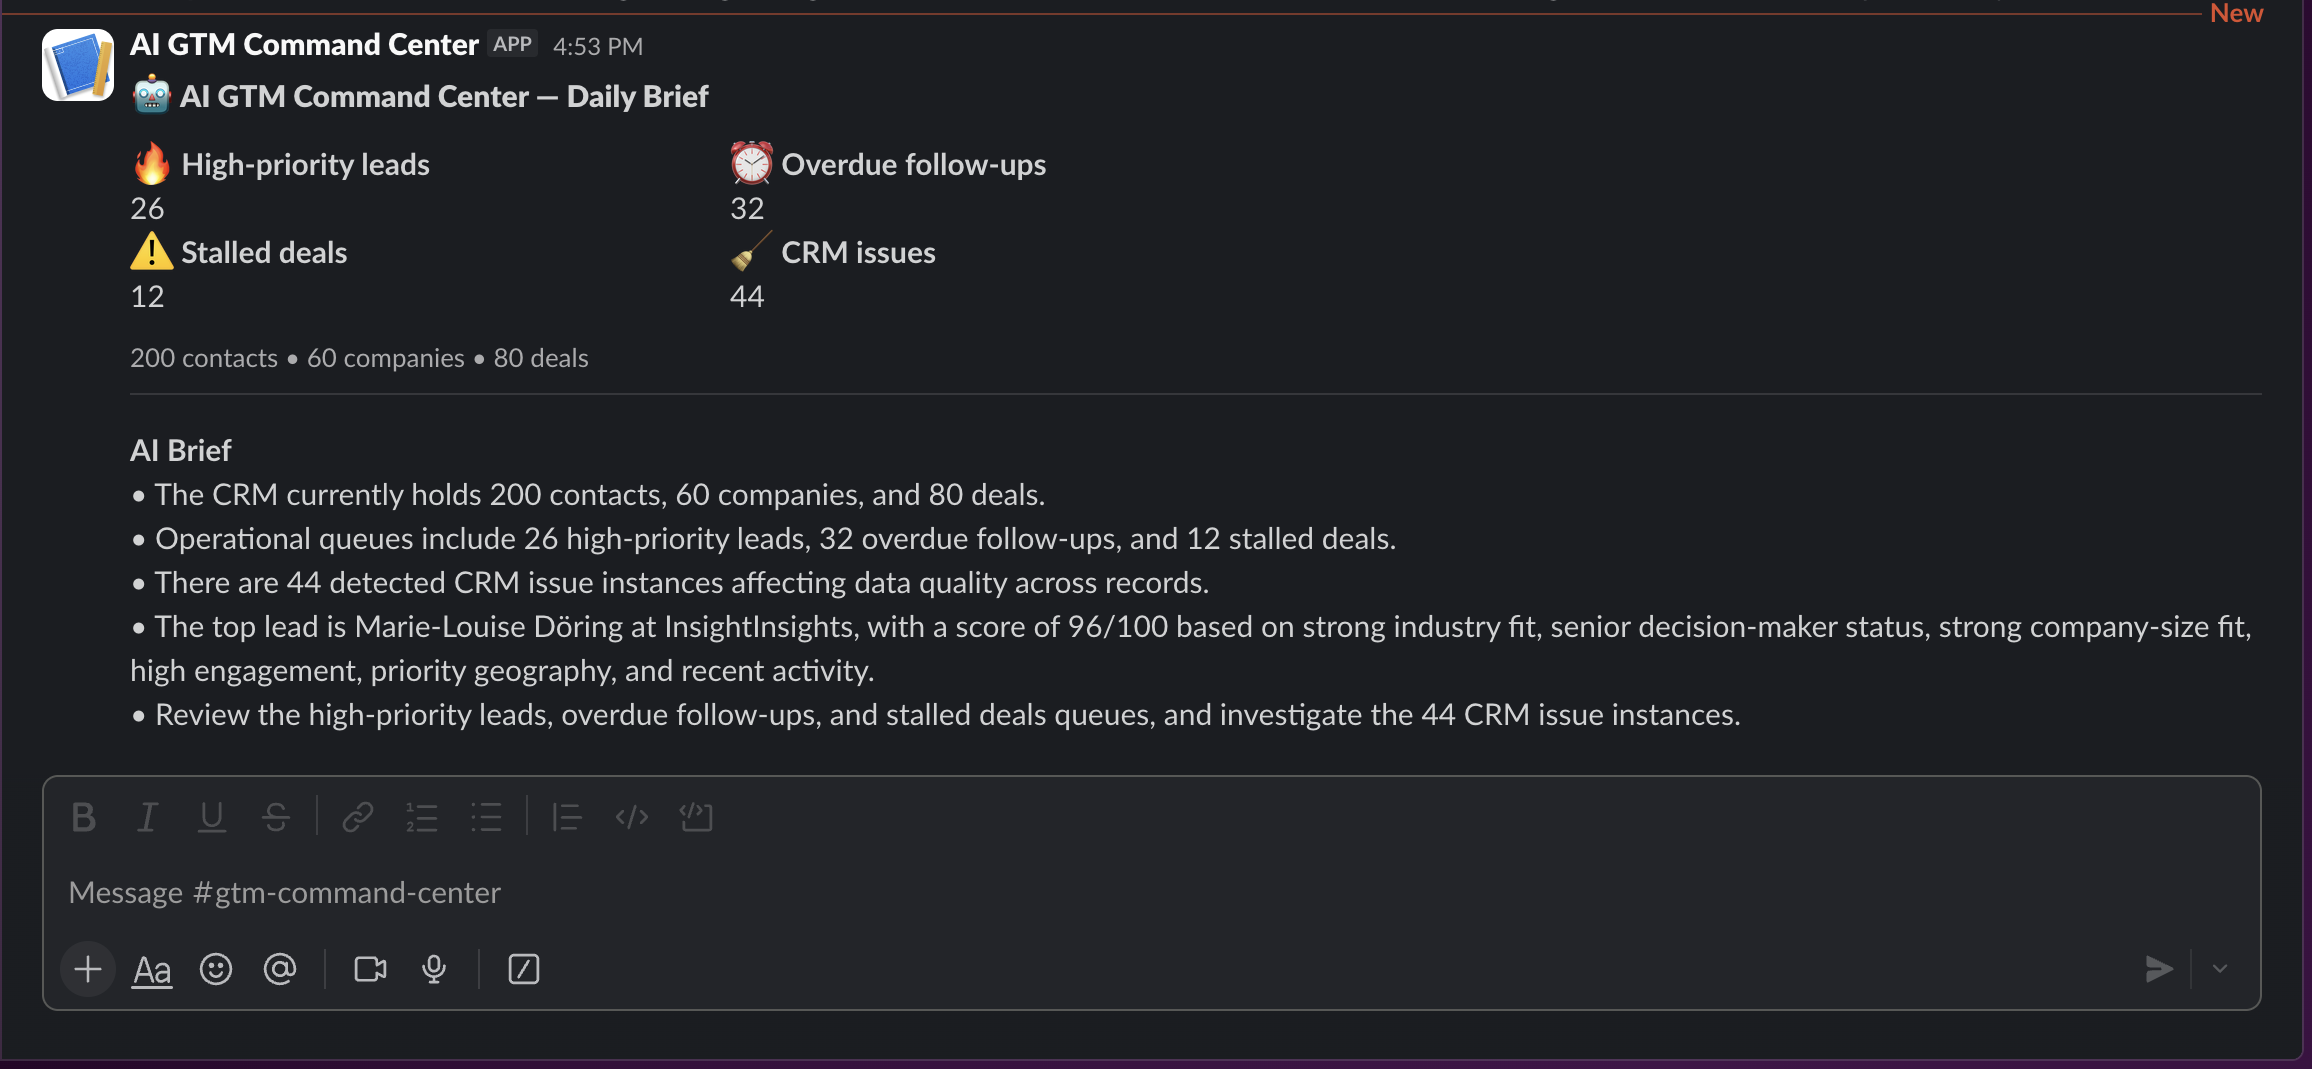
The important decisions are made by clear scoring and business rules. Groq AI is used afterwards to explain those results in simple language, create company briefs and prepare a daily GTM summary. The dashboard brings everything together, and important updates can be sent directly to Slack.
HubSpot stores the data. The GTM engine decides what needs attention. AI explains it. The dashboard and Slack turn the analysis into something the team can act on.
The CRM Behind It
To make the project realistic without exposing any customer data, I created a synthetic CRM dataset and loaded it into a real HubSpot workspace.
| CRM data | Simple meaning |
|---|---|
| 200 contacts | Individual people stored in HubSpot, such as managers, directors and other potential buyers. |
| 60 companies | The organizations those contacts work for. One company can have several contacts. |
| 80 deals | Potential sales opportunities that the team is currently tracking. |
The records are invented, but the system is not. The project uses real HubSpot objects, custom properties, associations and API calls. The same is true for Groq, Slack and the public Vercel deployment.
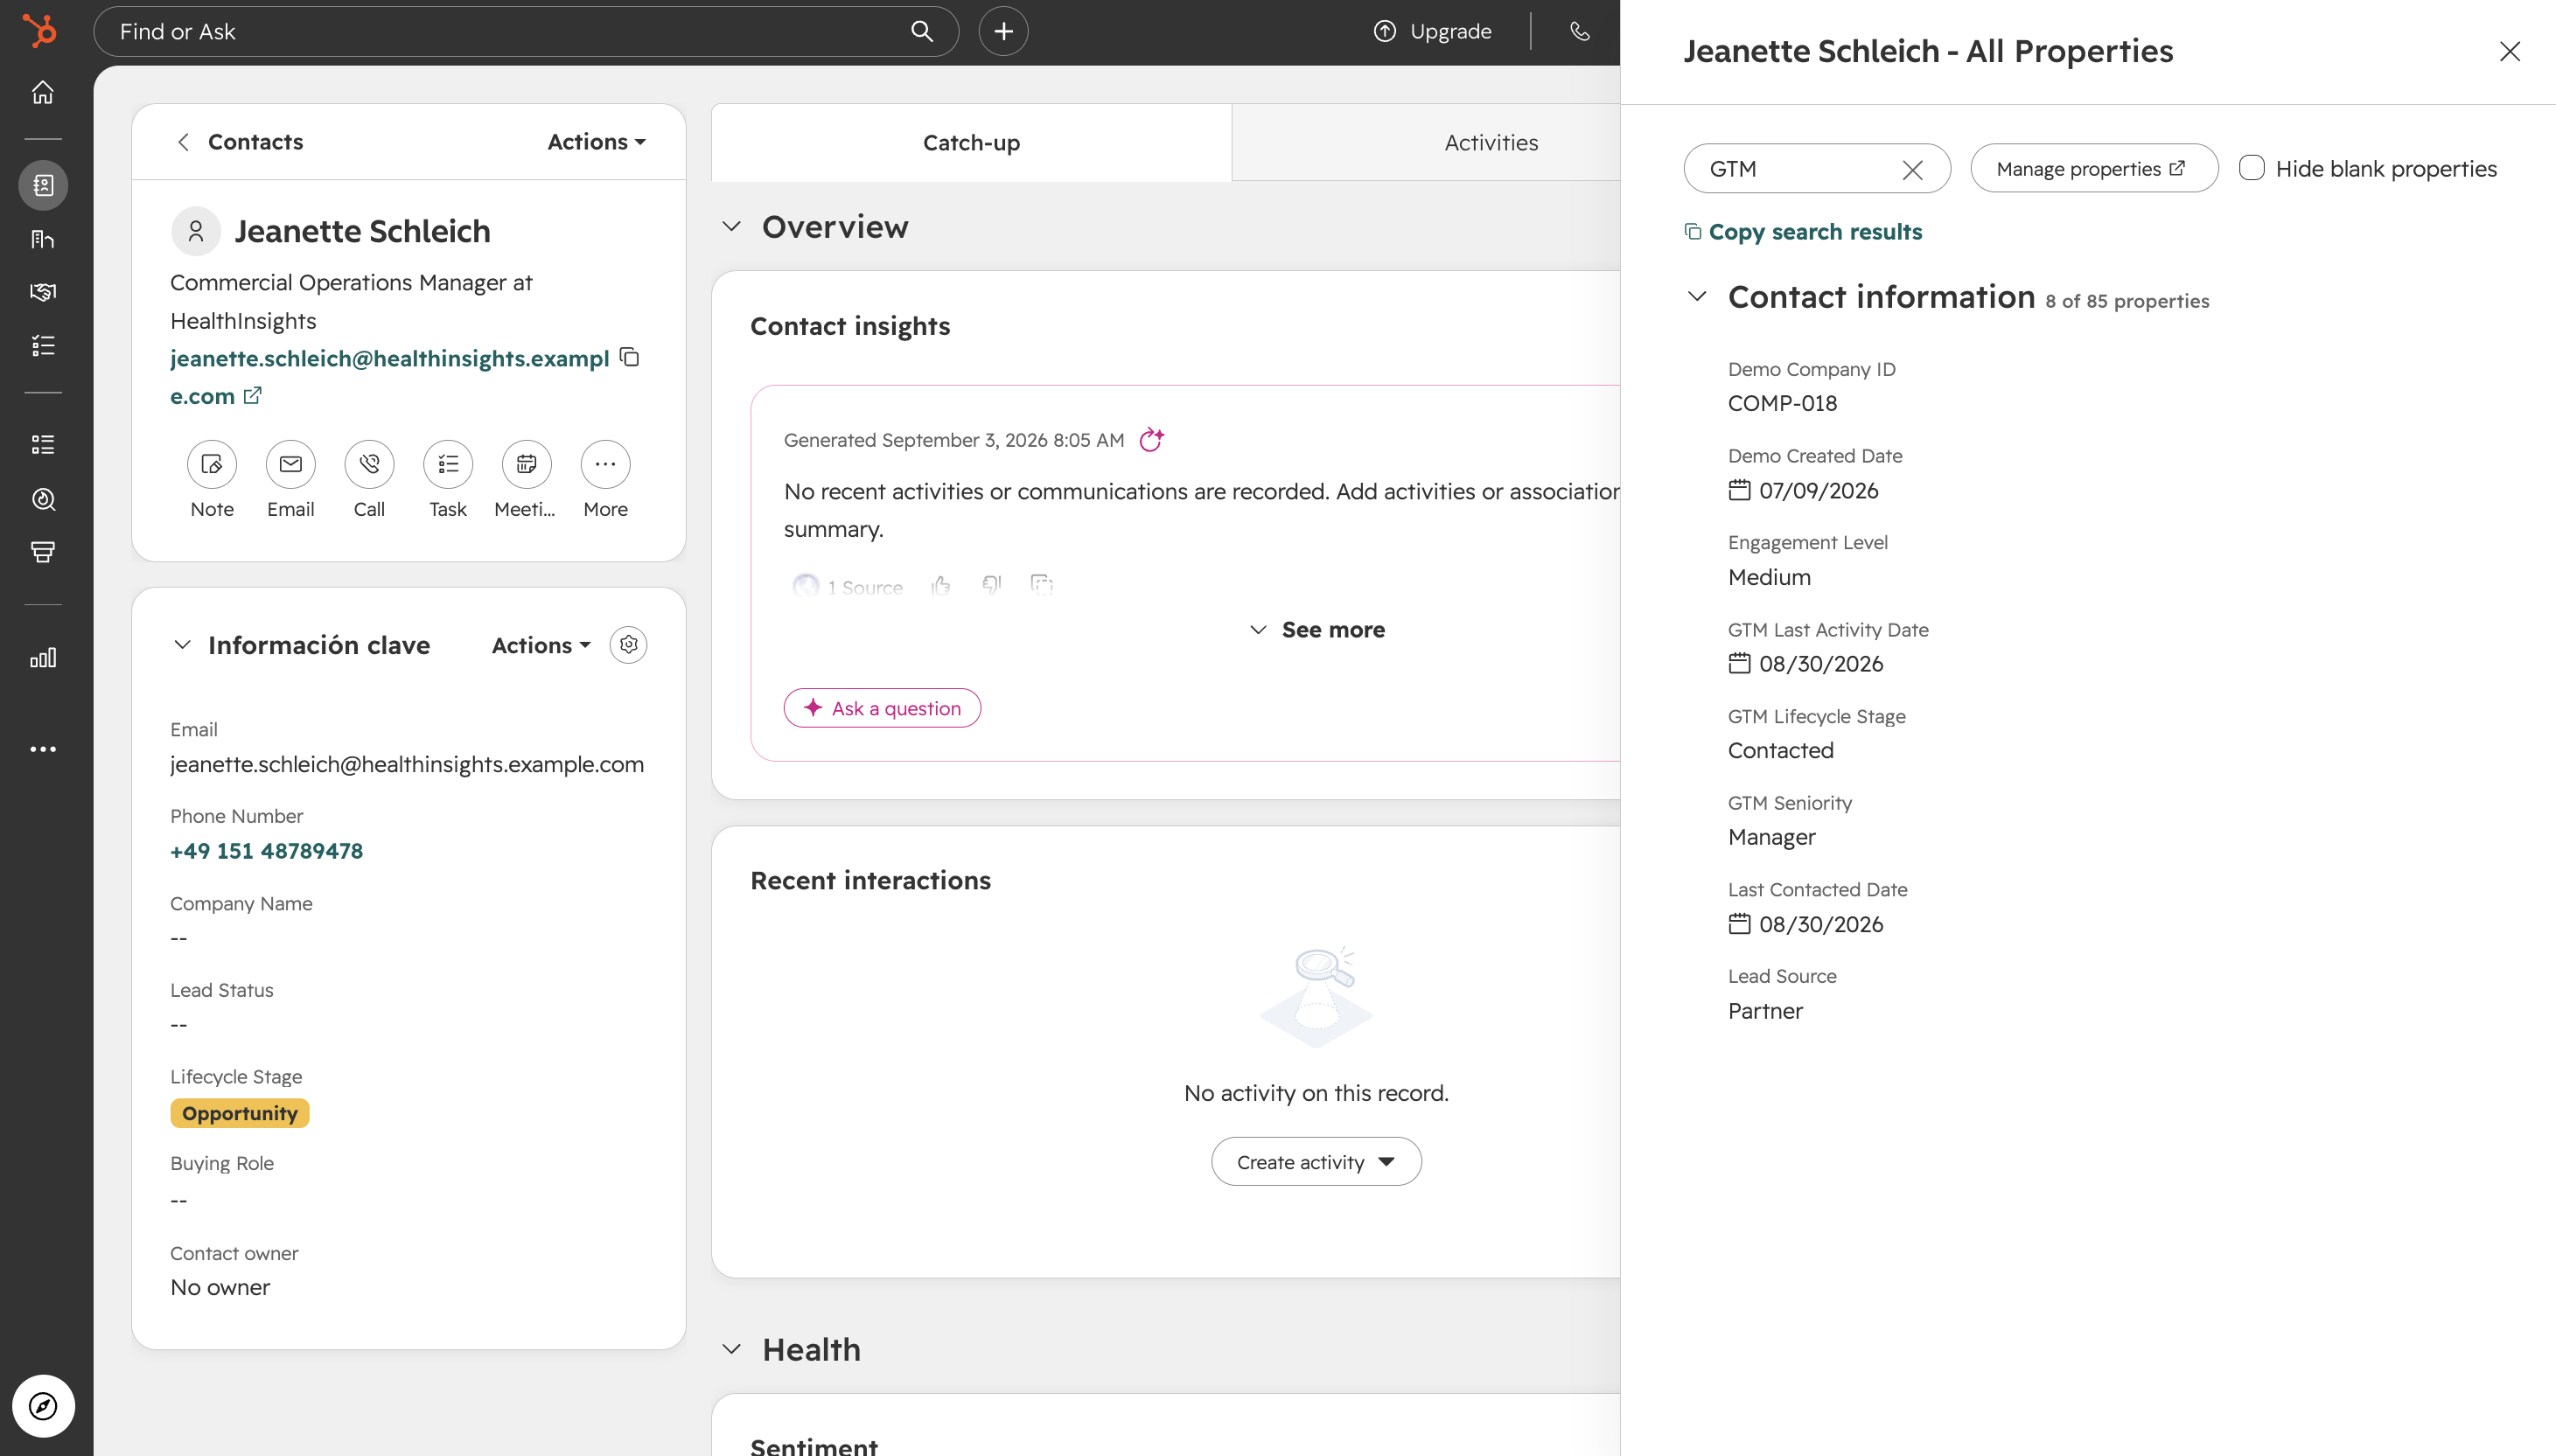
I also added GTM-specific fields to the CRM, such as seniority, engagement level, lifecycle stage and activity dates, together with company-level qualification data. These fields give the analysis engine enough context to make its decisions without asking an AI model to guess.
How the System Works
The project has a simple flow:
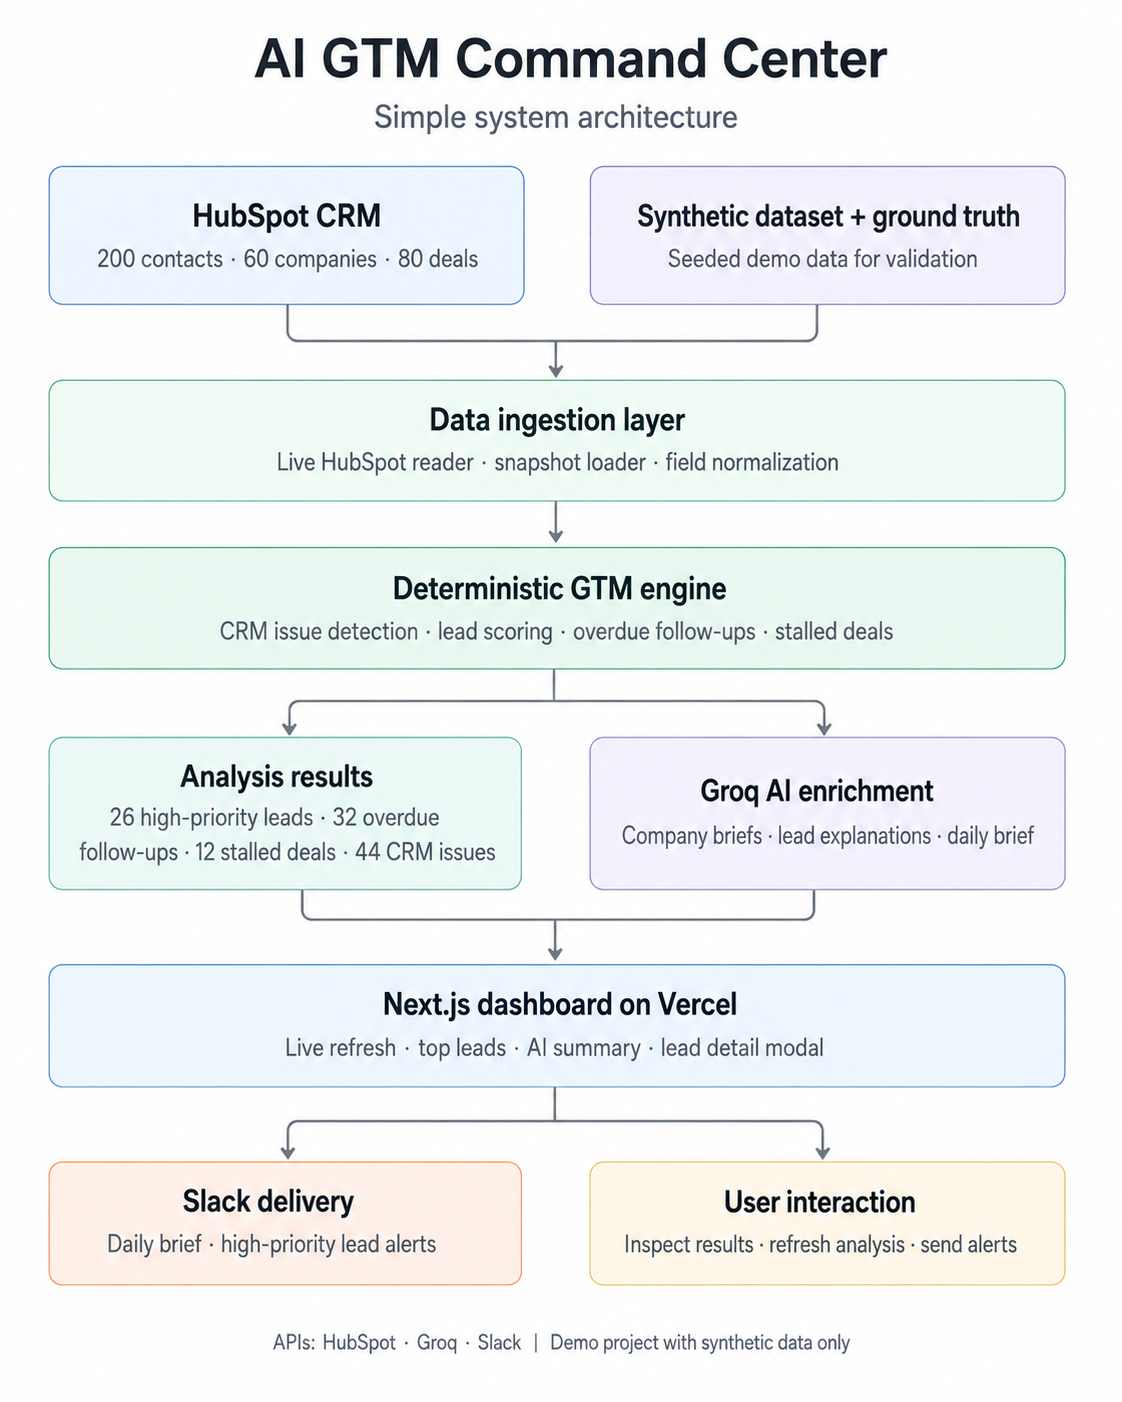
HubSpot → GTM Engine → Groq AI → Dashboard → Slack
HubSpot is the source of truth. The application reads the CRM records on the server and passes them to the GTM engine. The engine calculates lead priorities, checks for overdue follow-ups, finds stalled deals and looks for CRM data-quality problems.
Only after those decisions are made does Groq receive the relevant facts. Its job is not to decide who is important. Its job is to turn the result into a company brief, a lead explanation or a short daily summary that is easier for a person to read.
The result is then shown in the dashboard. For important cases, the same information can be pushed into Slack so the team does not need to keep the dashboard open all day.
What Happens When the Dashboard Refreshes?
The public dashboard can show the prepared demo data immediately. For the protected live demo, I can refresh the analysis directly from HubSpot.
- The application reads the current contacts, companies and deals from HubSpot.
- The GTM engine recalculates lead scores and operational queues.
- It checks follow-up dates, deal activity and CRM data quality.
- Groq creates a fresh daily summary from the results.
- The dashboard updates with the latest analysis.
If HubSpot is temporarily unavailable, the project can use a saved CRM snapshot. If the AI service is unavailable or rate-limited, it can use deterministic fallback text. That means one external service failing does not have to make the whole demo unusable.
What the System Found
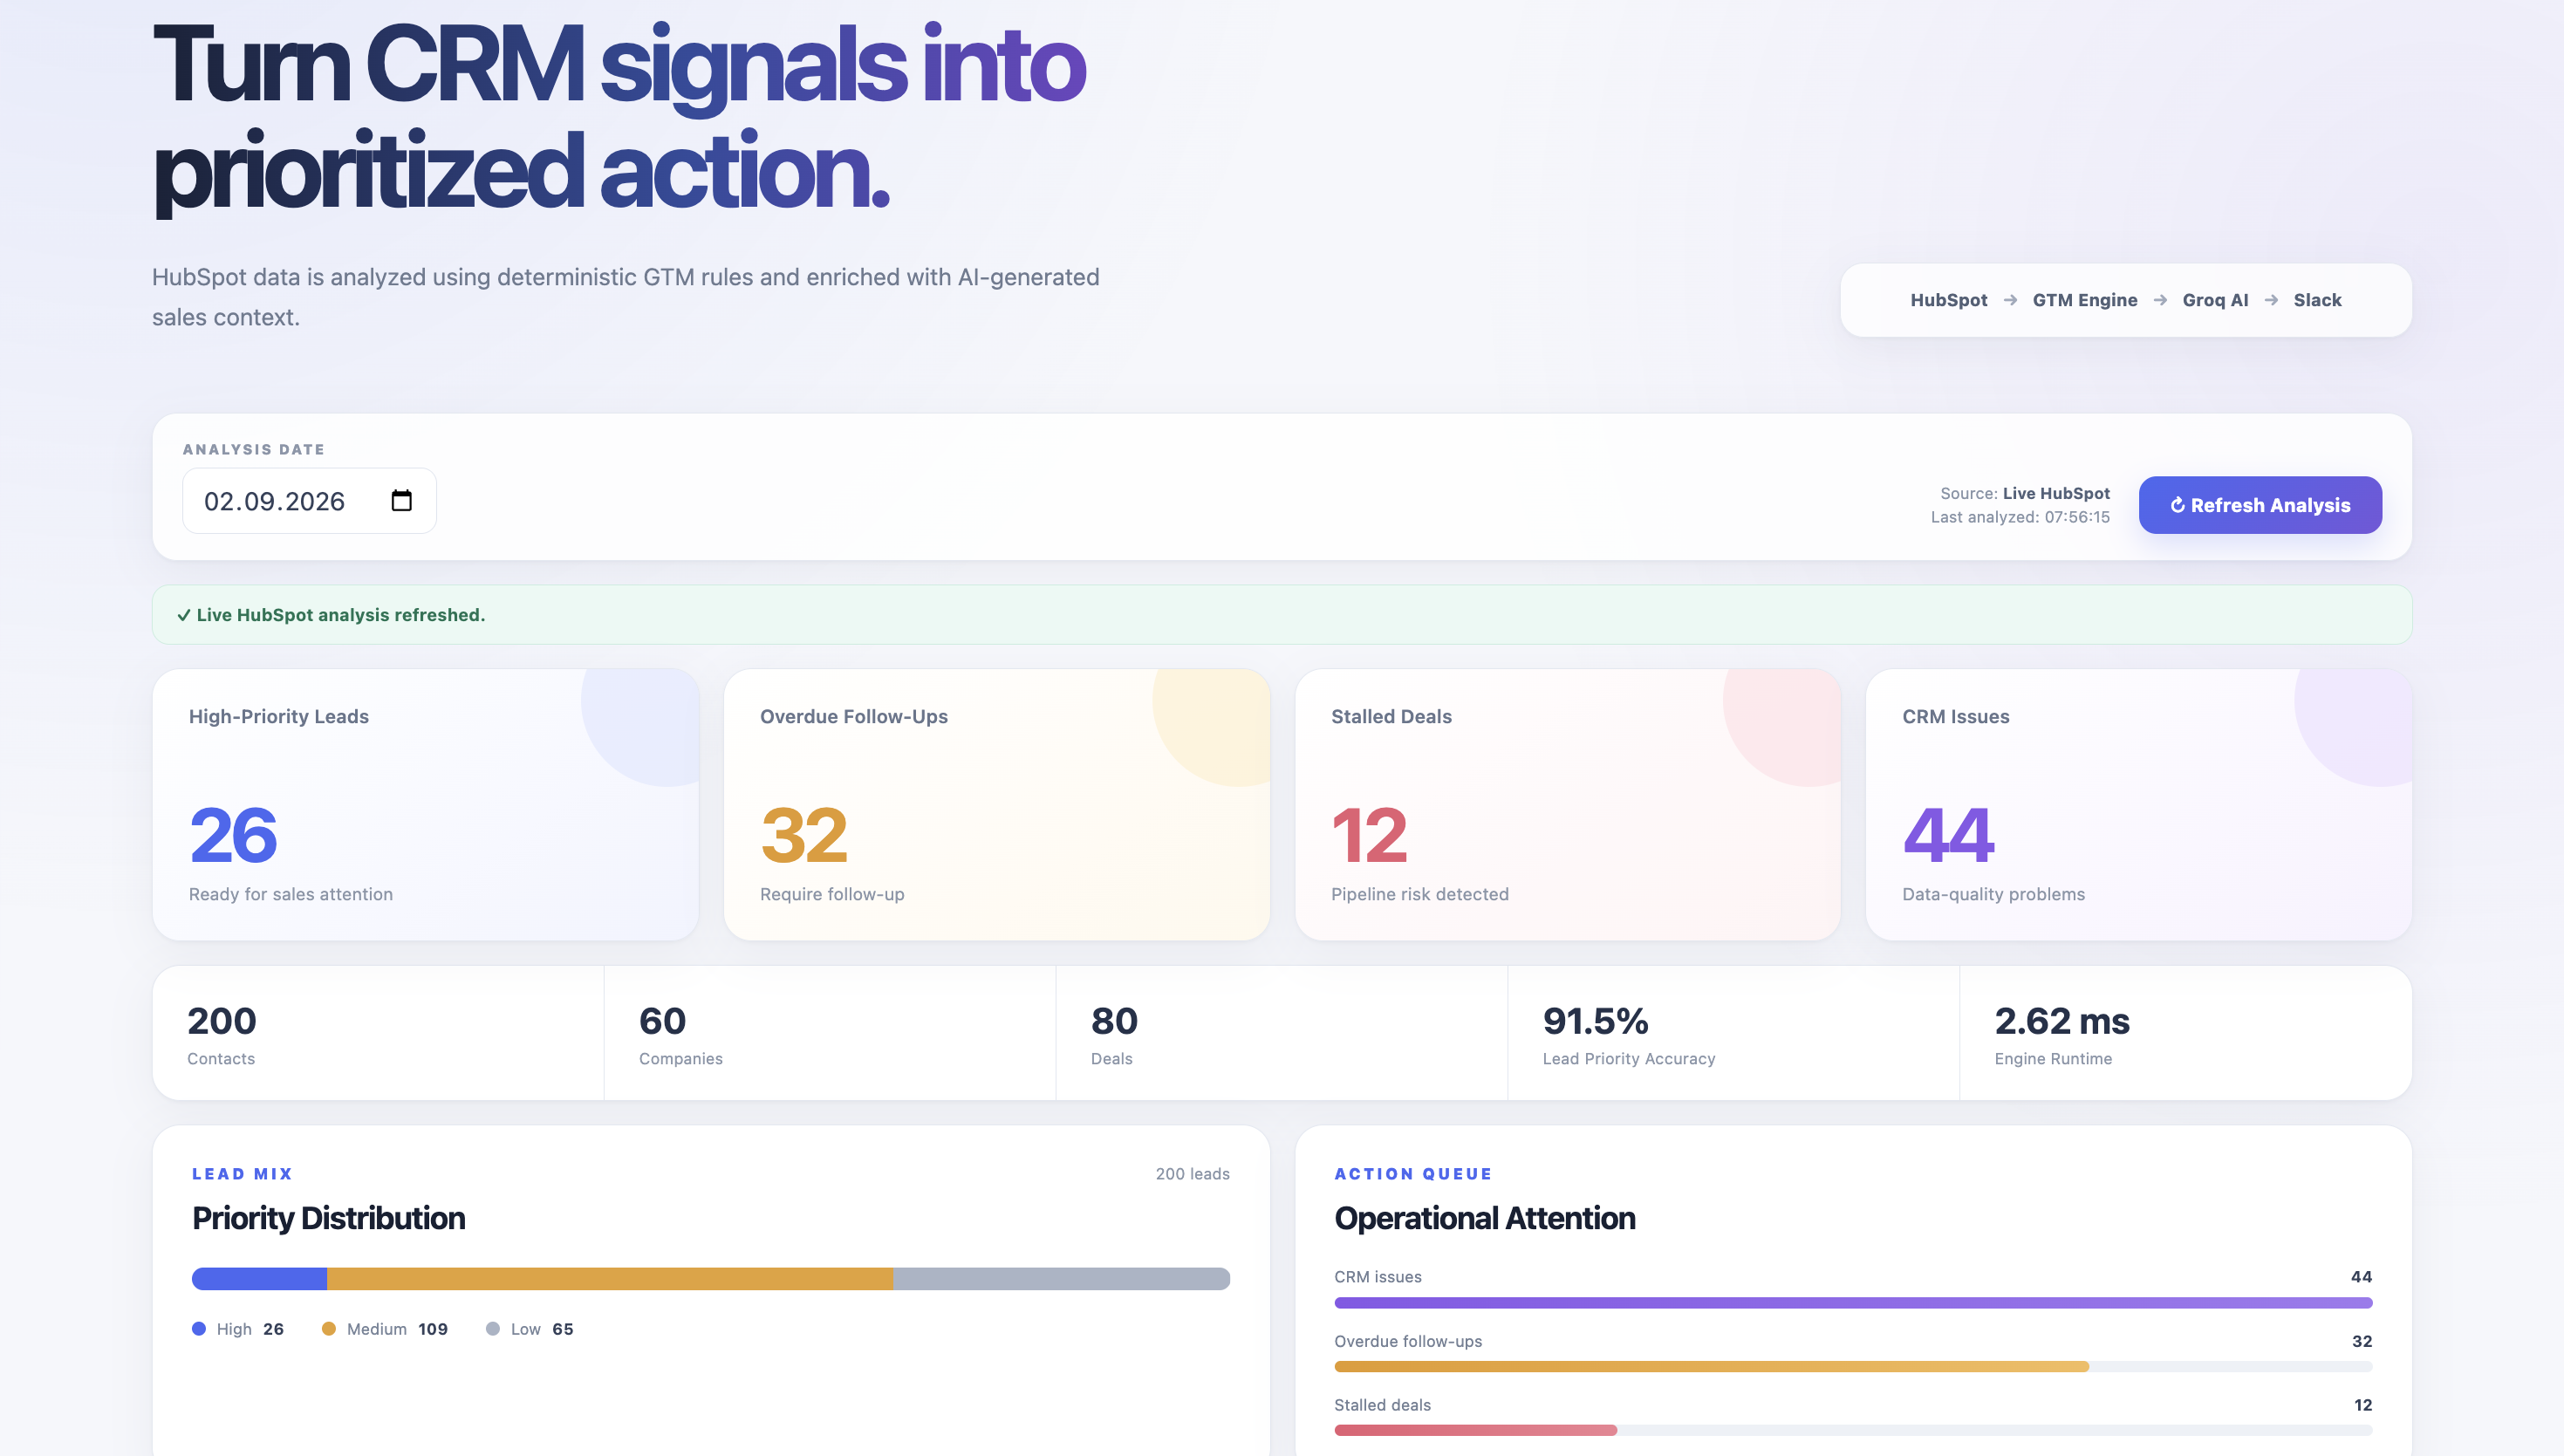
Instead of asking a salesperson to inspect all 200 contacts and 80 deals, the engine reduces the CRM into a few useful queues.
| What it checks | Result |
|---|---|
| Who deserves the most attention? | 26 HIGH, 109 MEDIUM and 65 LOW-priority contacts |
| Who has waited too long for a follow-up? | 32 overdue follow-ups |
| Which opportunities have stopped moving? | 12 stalled deals |
| Where is the CRM incomplete or inconsistent? | 44 CRM data-quality issue instances |
The 44 CRM issues are issue instances, not necessarily 44 different people. For example, one contact can have both a missing job title and an inconsistent field.
Lead Scoring Without a Black Box
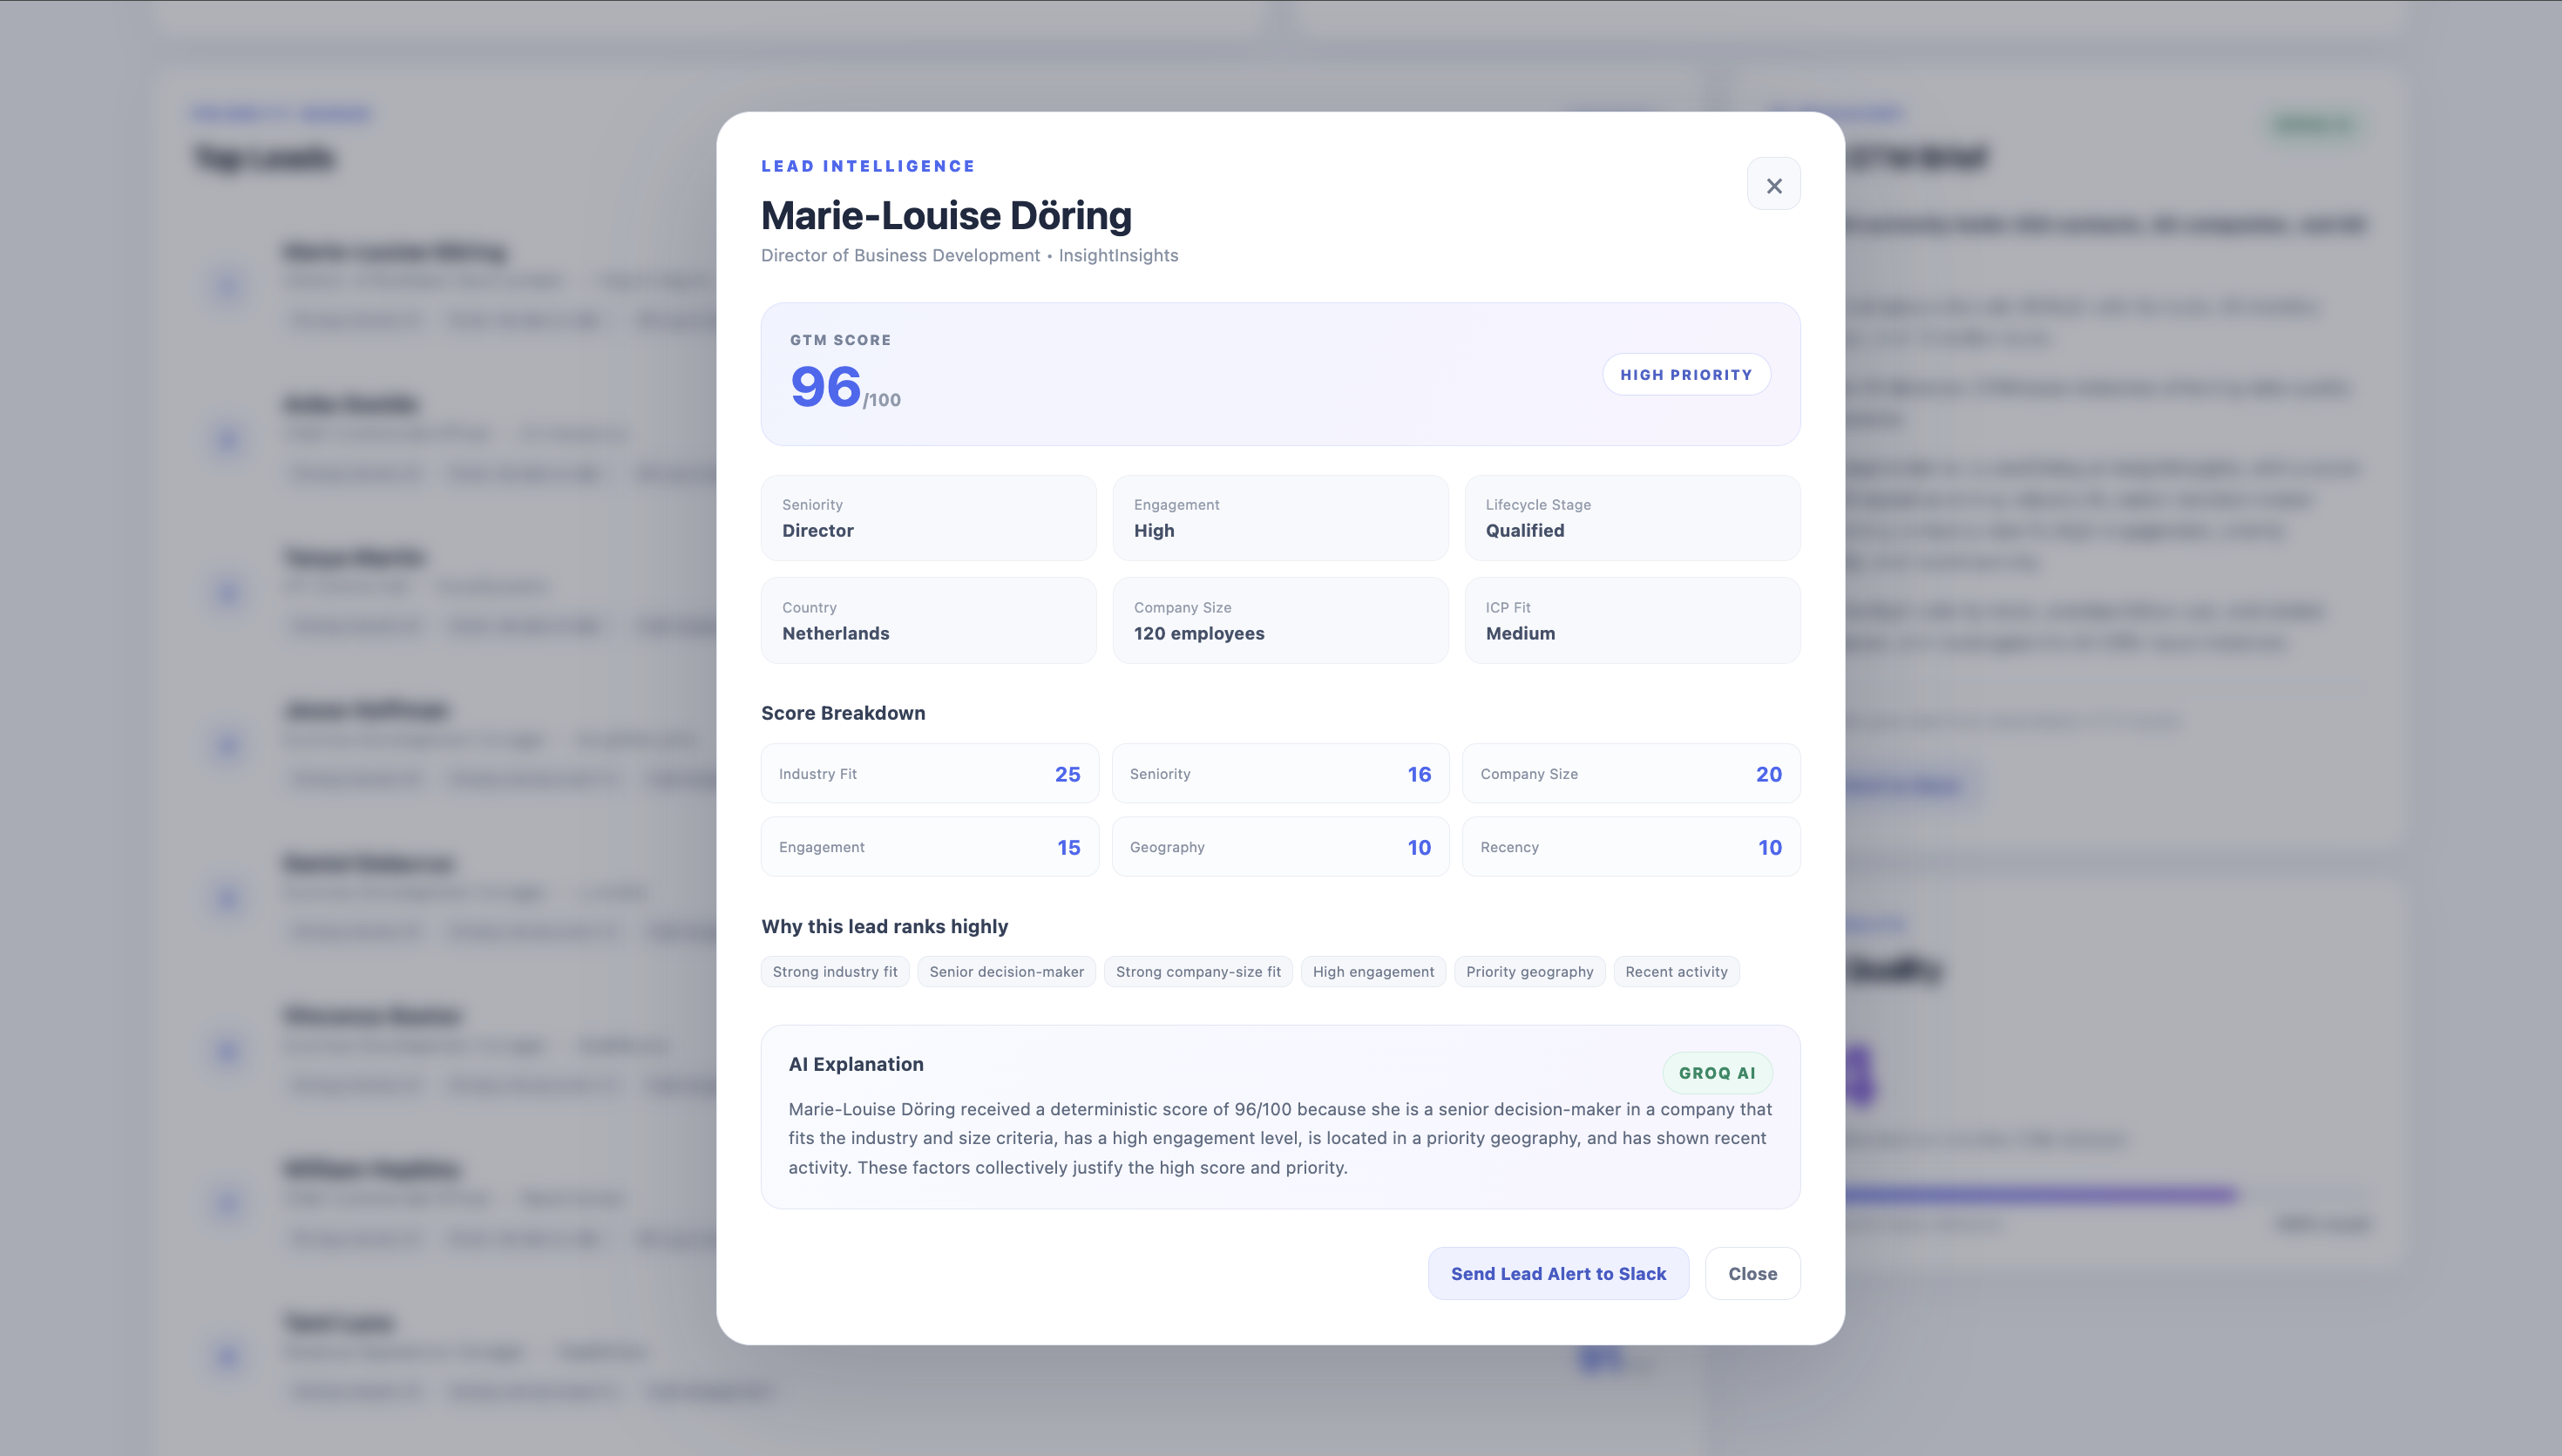
Every contact receives a score from 0 to 100 using six understandable signals: industry fit, seniority, company size, engagement, geography and recent activity.
A score of 85 or more is HIGH priority, 70 to 84 is MEDIUM, and anything below 70 is LOW. This lets the team quickly reduce 200 contacts to the 26 that currently deserve the most attention.
This part does not use an LLM. The same CRM facts always produce the same score. When a user opens a lead, the dashboard shows the score breakdown so the decision can be understood rather than treated as a black box.
Where AI Helps
I deliberately kept AI away from the actual scoring decision. AI is useful here because it can turn structured CRM facts into language that a salesperson can read quickly.
The project generates:
- 60 company briefs — one for each company.
- 26 lead explanations — one for each HIGH-priority lead.
- 1 daily GTM brief — a short summary of what needs attention today.
That is 87 AI outputs in total. The prompts instruct the model to stay inside the supplied CRM facts instead of inventing customer intent, company capabilities or business outcomes.
From Analysis to Action
A useful GTM tool should not stop at producing a score. The next question is what the team can do with it.
From the dashboard, a user can open a high-priority lead, inspect the score, read the AI explanation and send the lead directly to Slack. The daily GTM brief can also be pushed to the team with one action.
Evaluation
I did not want the project to end with “the dashboard looks right.” Because the CRM records are synthetic, I could create known expected cases and compare the system against them.
| Measure | Result |
|---|---|
| Lead-priority accuracy | 91.5% |
| Average lead-score error | 1.24 points |
| Seeded CRM issues detected | 44 / 44 |
| Seeded overdue follow-ups detected | 32 / 32 |
| Seeded stalled deals detected | 12 / 12 |
| AI outputs generated | 87 / 87 |
| AI outputs manually reviewed | 47 / 87 |
| Strict AI grounding pass rate | 93.6% (44 / 47 reviewed outputs) |
| Reviewed output completion after fixes | 100% (47 / 47) |
The perfect-looking detection counts need context: these were seeded rule-based cases in a controlled synthetic dataset. They show that the implementation found the cases it was designed to find; they are not claims of 100% real-world sales accuracy.
For the AI layer, I reviewed 20 company briefs, all 26 high-priority lead explanations and the daily brief. The first review found truncated answers and some unsupported wording. I tightened the prompts and generation settings, regenerated the outputs and reviewed them again.
The second review reached a 93.6% strict grounding pass rate across the 47 reviewed outputs, with 100% completion. All 26 high-priority lead explanations passed the grounding review. The grounding percentage therefore describes the reviewed set, not all 87 generated outputs.
The evaluation became part of the build: test the output, find what is actually wrong, improve it, and test again.
Technologies
- HubSpot: CRM contacts, companies, deals, associations and custom GTM properties.
- TypeScript: deterministic lead scoring and operational analysis.
- Groq: grounded company briefs, lead explanations and daily summaries.
- Next.js: the interactive dashboard and server-side API routes.
- Slack: daily briefs and high-priority lead alerts.
- Vercel: public deployment with protected live actions.
Conclusion
The AI GTM Command Center turns a CRM full of records into a much simpler question: what should the sales team pay attention to now?
Instead of manually searching through 200 contacts and 80 opportunities, the user gets prioritized leads, overdue follow-ups, stalled opportunities, CRM-quality problems and short explanations in one place.
The project also separates two jobs that are often mixed together in AI demos: rules make the operational decisions, while AI makes those decisions easier to understand.
The data is synthetic, but the complete workflow across HubSpot, the GTM engine, Groq, the live dashboard and Slack is real and can be demonstrated end to end.