Electric Vehicle Data Analysis
Interactive Dashboard Project Using Tableau
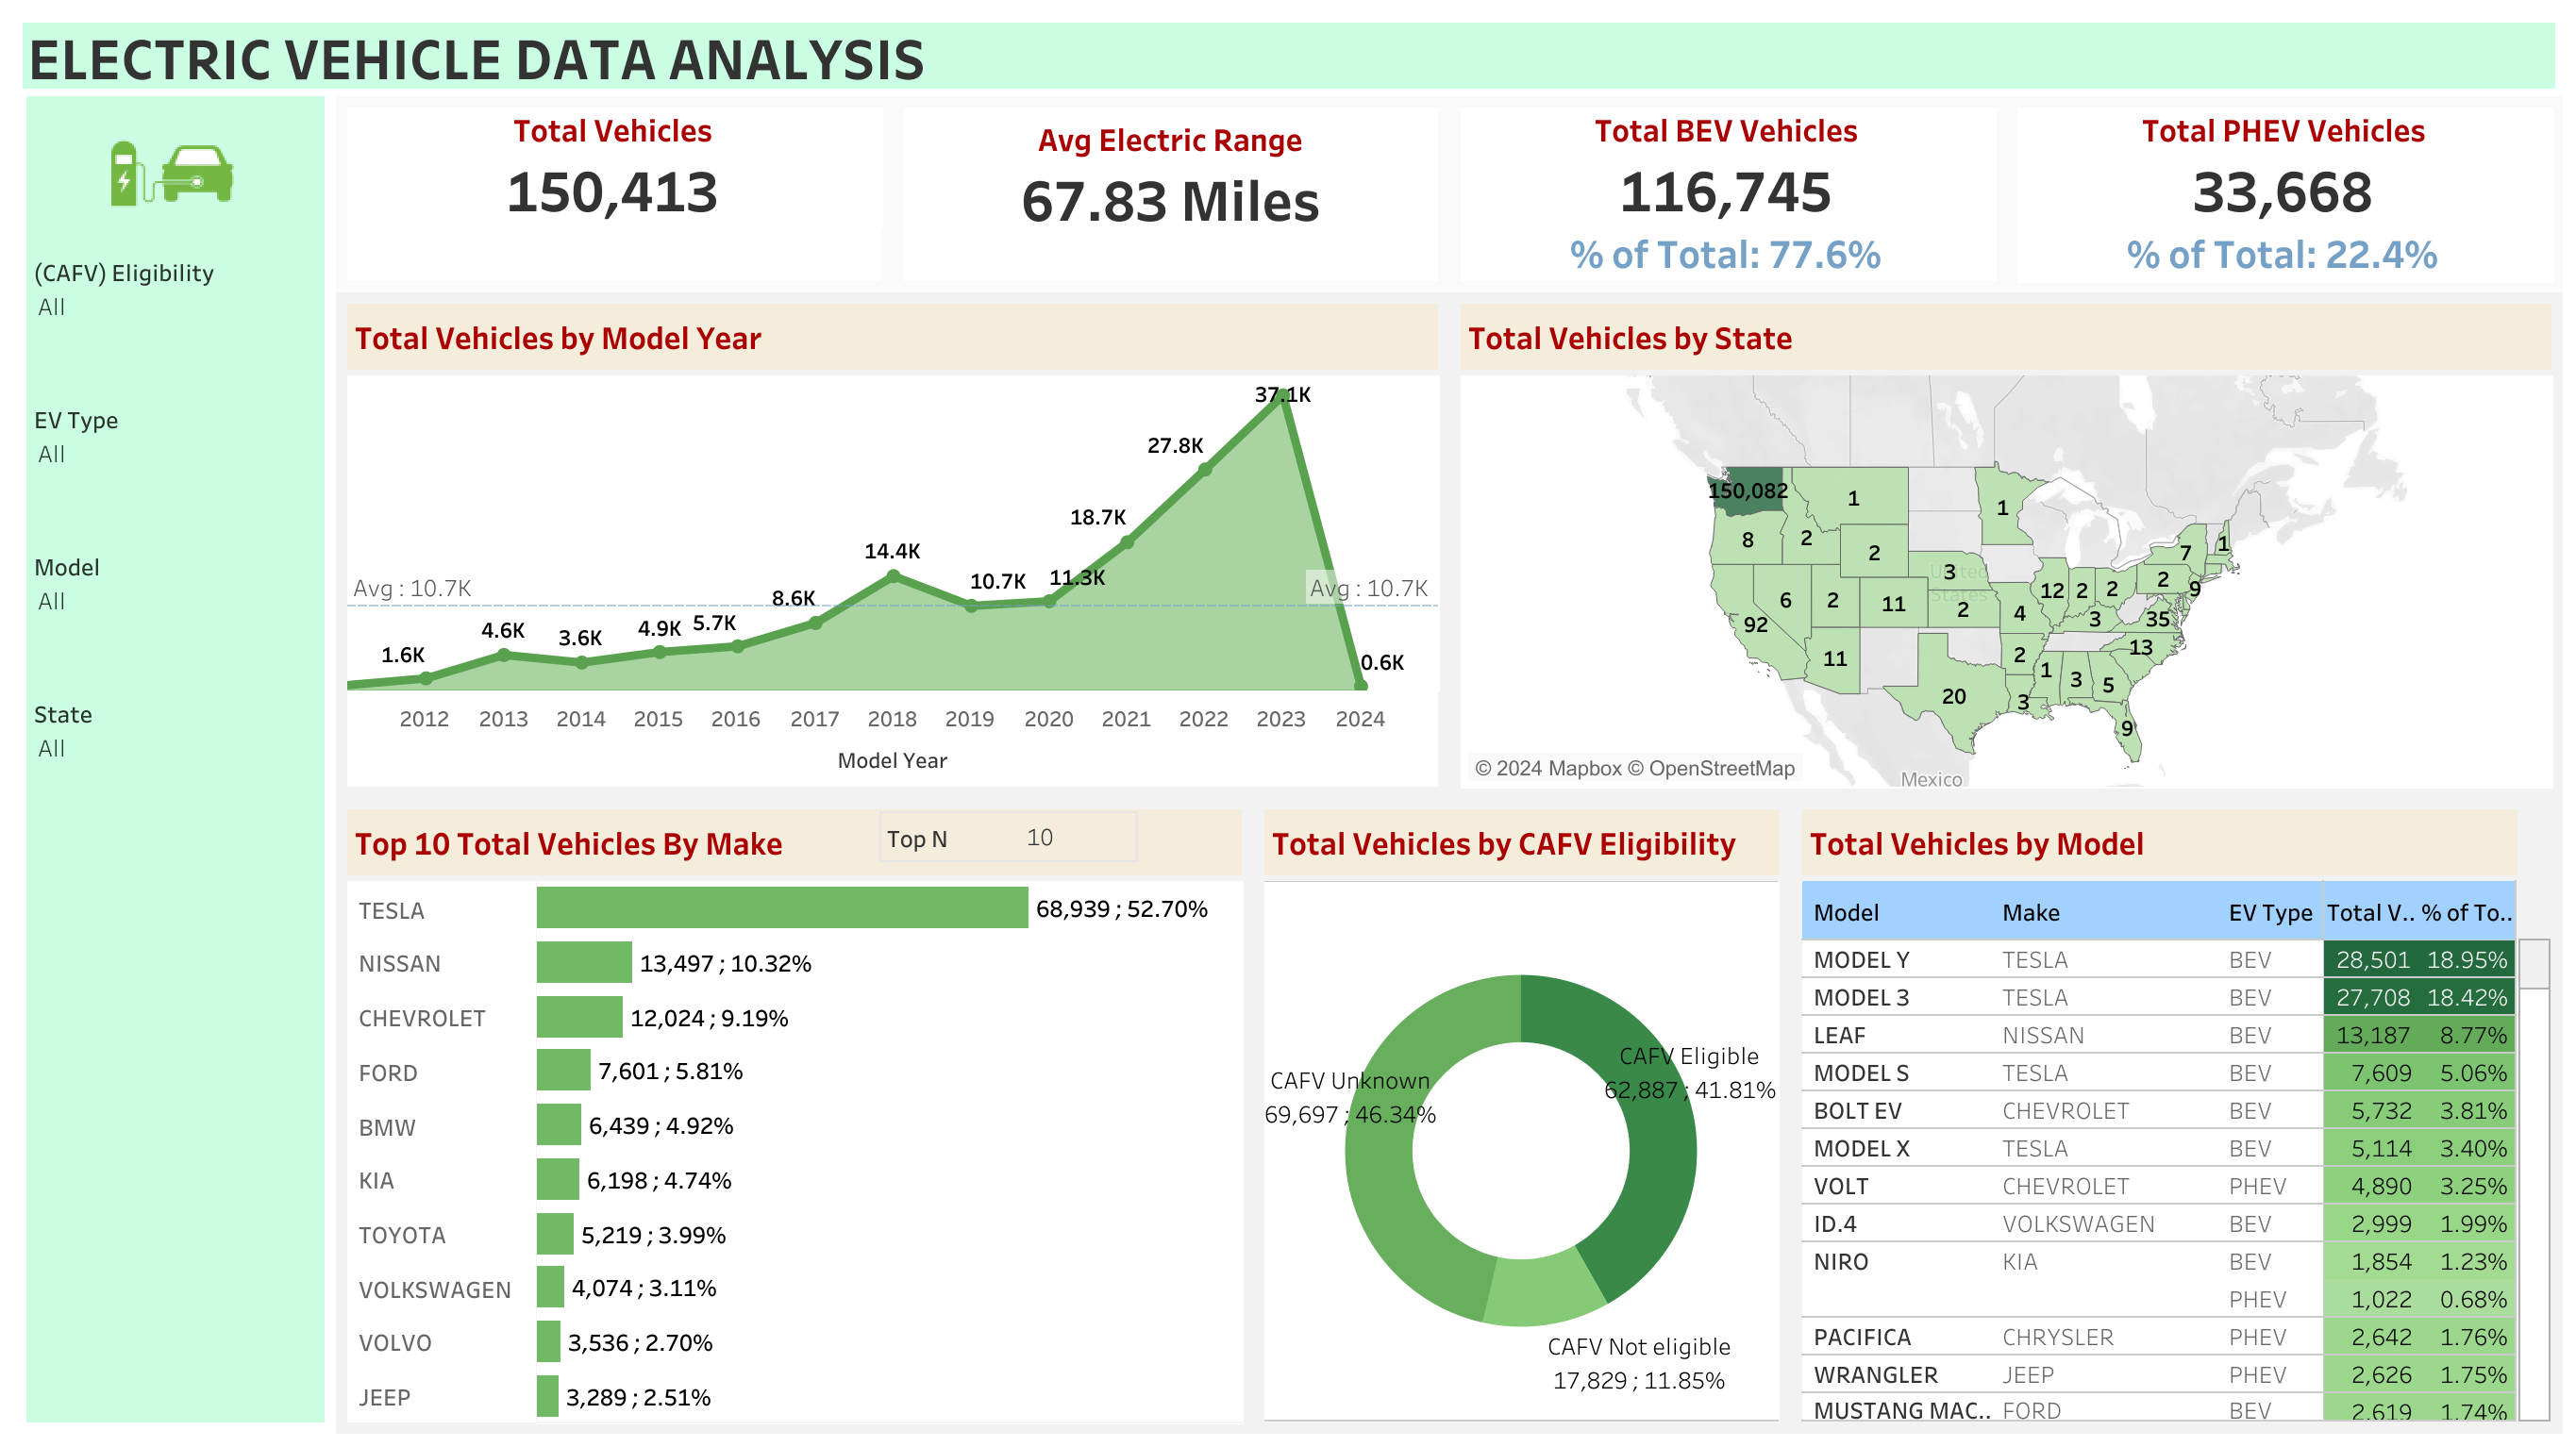
Project Overview: This project focuses on developing an interactive dashboard using Tableau to analyse and visualise electric vehicle data. The goal is to provide a comprehensive overview of the electric vehicle market through dynamic and visually appealing charts and graphs, offering insights into various metrics.
Skills and Concepts
- Total Vehicles Analysis: Calculated the total number of electric vehicles, distinguishing between Battery Electric Vehicles (BEVs) and Plug-in Hybrid Electric Vehicles (PHEVs), and determined their percentage share in the overall market.
- Average Electric Range: Computed the average electric range of vehicles to understand performance across different models.
- Geographical Distribution: Analyzed the distribution of electric vehicles across different states using a geographical map to identify regions with high and low adoption rates.
- Top Manufacturers: Identified the top 10 electric vehicle manufacturers, visualising the total number of vehicles produced and their market share.
- Clean Alternative Fuel Vehicle (CAFV) Eligibility: Determined the eligibility of vehicles for clean alternative fuel vehicle credits and visualised the percentage of eligible, not eligible, and unknown status vehicles.
- Model Year Analysis: Analysed the total number of electric vehicles by model year from 2011 onwards to observe adoption trends over time.
Conclusion
This project demonstrates the ability to derive actionable insights from raw data, optimize business strategies, and create user-friendly visualizations. Key tasks included data preparation, calculation of metrics, geographical analysis, manufacturer comparison, eligibility assessment, and trend analysis, ultimately informing and enhancing understanding of the electric vehicle market.
Dashboard
You can view the dashboard project onhere.